Interactive Control Systems Tools
System Analysis
Analysis of a 2-nd order systems (time domain)

-
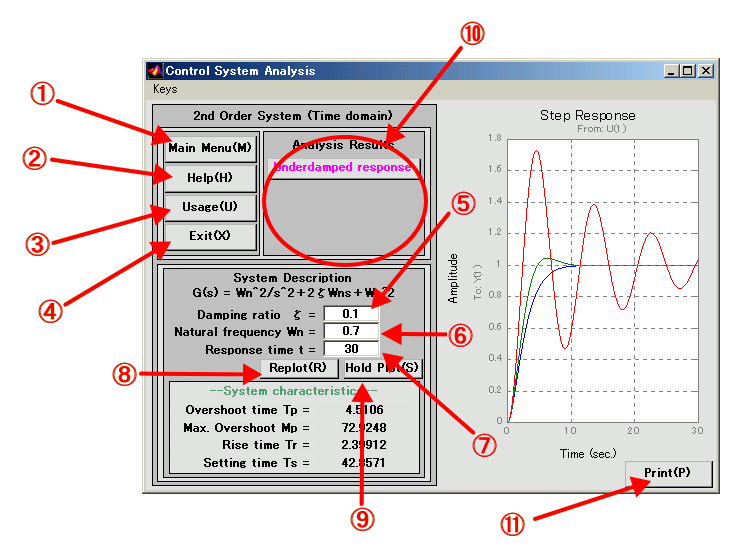
- 1. "Main Menu" Button
- Return to the Main Menu Screen
- 2. "Help" Button
- Explanation of the purpose of this screen and how to work with it.
- 3. "Usage" Button
- Help about how to manipulate the screen.
- 4. "Exit" Button
- Exit from the Control Systems Tools.
- 5. Edit box for the damping ratio
- Only non-negative values for the damping ratio are allowed.
- 6. Edit box for the undamped natural frequency
- Only non-negative values for the natural frequency are allowed.
- 7. Edit box for the "Response time"
- Maximum time for the time axe of the graph in the right-side window.
- 8. "Replot" Button
- After setting the respective values for the system description, by pressing the "Replot" button time response curve of the system is shown in the right side. The horizontal axe scale can be set by changing the value in the "Response Time" edit box. If already a plot is shown, "Replot" is performed after clearing the previous shown plot.
- 9. "Hold plot" Button
- Has same usage as "Replot" button, except that if a plot already is shown it is not cleared before plotting the new one.
- 10. "Analysis Results" Area
- In this part of the window the results from the analysis of the system are shown as a short text string inside a button. Selecting the button of interest invokes a help screen with more detailed explanation.
- 11. "Print" Button
- Allows printing of the whole screen.
-

