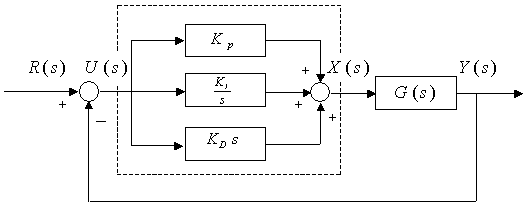
Figure: PID control of a plant
Interactive Control Systems Tools
System Design
Design of PID compensator
PID control
An outline of the PID compensator design is given here. For more detailed description and deeper theoretical background many textbook in control theory will help enouh.
It is interesting to note that more than half of the industrial controllers in use today utilize PID or modified PID control schemes. Analog PID controllers are mostly hydraulic, pneumatic, electric, and electronic types or their combinations, but many of these are transformed in digital forms trough use if microcontrollers and microprocessors. Modified forms of PID control, such as I-PD control and two-degrees-of-freedom PID control, are currently in use in industry.
The figure below shows a PID control of a plant. If the mathematical model of the plant can be derived, then it is possible to apply various design techniques to determine the parameters of the controller that will meet the transient and steady-state specifications of the closed-loop system.

Figure: PID control of a plant
R(s):Reference input, U(s): Input error, X(s): Control input, Y(s): Output,
G(s): Plant transfer function
However, if the plant is so complicated that the mathematical model cannot be obtained easily, then analitical approach to the controller design is not applicable. Then we must resort to experimental approaches to the tuning of the PID controllers. Ziegler and Nichols suggested rules for tuning PID controllers based on experimental step responses or based on the value of Kp that results in marginal stability when only the proportional action is used.
In this tool we do not use Ziegler-Nichols method, but we are going to implement it in the next version.
Here, the analytical method used in the tool for design of PID controller is briefly presented.
The loop gain of a PID controller is given by

If G(s) is a type n plant, the compensated system will be of type n+1. Then the error constant is equal to inverse of the steady state error:
 .
.
For a given steady state error specification, we can find Ki from the preceding equation. From the time domain specifications such as overshoot and settling time, the required closed loop damping ratio and the natural frequency can be determined. It is known that the close loop natural frequency corresponds to the open loop gain crossover frequency and the desired phase margin (PM) can be from the closed loop damping ratio. Therefore, at the gain crossover frequency the compensated system should have a gain of 1 and a phase of 180degree+PM.
With the above information we can write

which leads to

Additional (basic) explanations
Here a brief explanation about Bode diagrams of P (proportional), I (integral), and D (differential) factors is given.
1. Proportional (constant) factor: Kp
Since
![]()
and

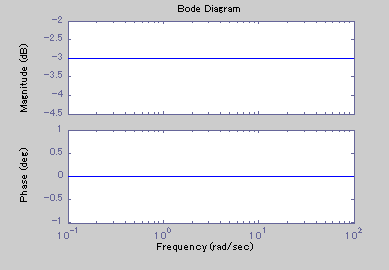
The bode diagram of the proportional part is shown in the next figure:

図ようになり、ゲインがKpの値で桁上げされた直線であり、一定の特性をもっている事がわかります。
2. Integral factor
The magnitude of the integral factor is given by
![]()
or
![]()
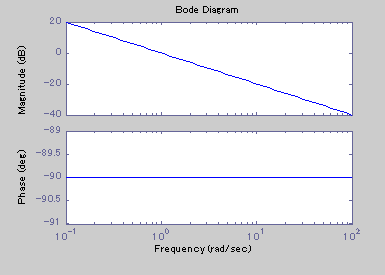
It is clear that the Bode diagram conists of a stright line, with a slope -20dB/dec.
The phase is
![]() .
.
The magnitude for Ki=1 and the pahase curves are:

3. Differential factor
The magnitude of the differential factor is given by
![]()
or
![]()
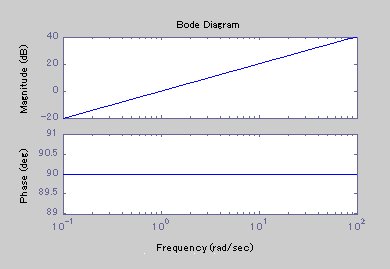
It is clear that the Bode diagram conists of a stright line, with a slope 20dB/dec.
The phase is
![]() .
.
The magnitude for Kd=1 and the pahase curves are:
