Interactive Control Systems Tools
Control systems analysis
Analysis of a 2-nd order systems (frequency domain)
The term frequency response means the steady-state response of a system to a sinusoidal signal. In frequency response the frequency of the input signal is varied over a certain range and the resulting response is studied.
In general, the frequency response of a control system presents a qualitive picture of the transient response, but the correlation between frequency and transient responses is indirect, except for the case of second-order systems.
Bode diagrams for a 2-nd order system
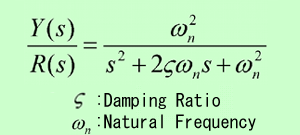
Consider a transfer function of a 2-nd order system which, generally is represented by the following transfer function:

If the damping ratio is larger than 1, the second order system can be expressed as a product of two first-order factors with real poles. If the dumping ratio is between 0 and 1, the expression is a product of two complex conjugate factors.
The asymptotic frequency-response curve can be obtained as follows: Since

the log magnitude for low frequencies, high frequencies, and for the corner frequency respectively becomes:
 .
.
The low frequency asymptote is thus a horizontal line at 0dB. The equation for the high frequency asymptote is a straight line having the slope -40dB/decade. The high-frequency asymptote intersects the low-frequency one at the point where the input signal has frequency equal to the natural undamped frequency. The two asymptotes do not depend on the damping ratio. Near the natural undamped frequency a resonant peak occurs, and the magnitude of the resonant peak depends on the value of the damping ratio. Errors obviously exist in the approximation by straight-line asymptotes. At the resonant peak the gain has its maximum, i.e. this maximum occurs at
![]() .
.
When the value of the damping ratio is bigger than
![]()
there is no resonant peak.
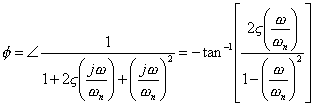
The phase angle of the second order system is

and the phase angle is a function of both damping ratio and the frequency. The values of the phase angle for low, high, and the corner frequency are

The phase-angle curve is skew symmetric about the inflection point, the point where the phase is -90 degree. There are no simple ways to sketch such phase curves.
Basic definitions about Bode diagrams
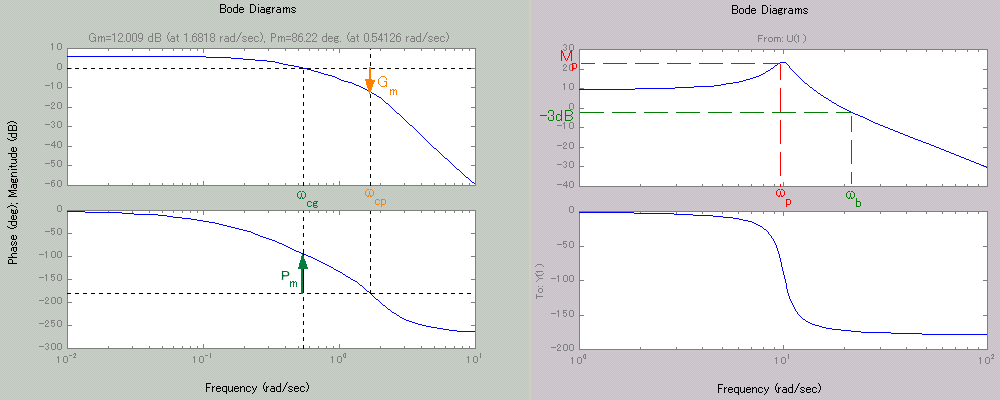
A Bode diagram consists of two graphs: One is a plot of the logarithm of the magnitude of a sinusoidal transfer function; the other is a plot of the phase angle; both are plotted against the frequency in logarithmic scale.
The following parameters characterize important properties of the system considered:
