Interactive Control Systems Tools
Basic Definitions about Bode Plots
A Bode diagram consists of two graphs: one is a plot of the logarithm of the magnitude of a sinusoidal transfer function; the other is a plot of the phase angle. Both are plotted against the frequency (in degrees) in logarithmic scale.

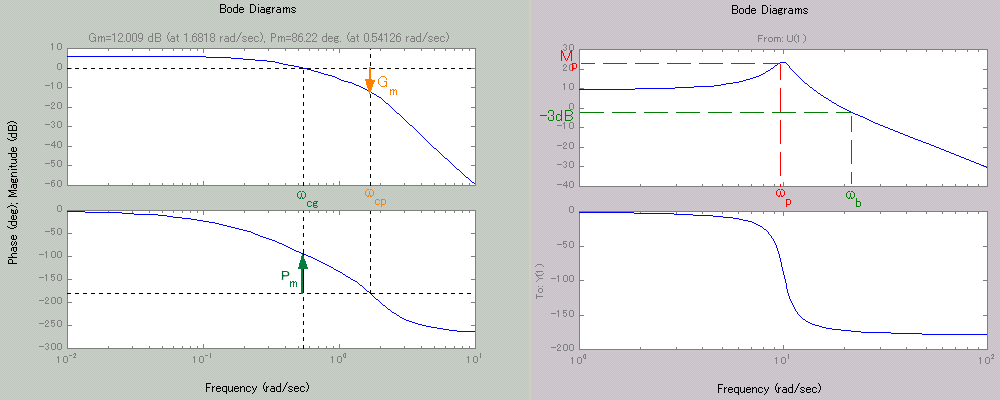
- 1. Gain Margin (Gm)
- The gain margin can be read off the Bode plot by measuring the distance to unity gain (i.e. 0 dB) when the phase is -180 degrees.
-
- 2. Phase Crossover Frequency (Wcp)
- The frequency where the phase is -180 degrees is called phase crossover frequency.
-
- 3. Phase Margin (Pm)
- Phase margin is defined as the minimum amount of phase lag that can be added to the system to destabilize it. On the Bode plot the phase margin can be determined at the frequency where the gain crosses 0 dB line.
-
- 4. Gain Crossover Frequency (Wcg)
- The gain crossover frequency is the frequency at which the magnitude of the loop gain is unity.
-
- 5. Resonant Peak Value (Mp)
- At the resonant frequency the magnitude has a peak called resonant peak. For damping ratio > 0.707 there is no resonant peak. The magnitude of the resonant peak can be found by

-
- 6. Resonant frequency (Wp)
- The frequency at which the magnitude response has maximum value. The resonant frequency is

-
- 7. Bandwidth (Wb)
- The bandwidth of a low pass system is defined as the frequency where the magnitude drops by a factor of 0.707=-3 dB of its DC value (i.e. gain at zero or low frequency).


