Interactive Control Systems Tools
System Analysis
Analysis of SISO system (frequency domain)
In this toolbox the Nyquist plot, Nichols chart, and Bode plot are used. A brief description about these is given below.
The polar or Nyquist plot diagram shows the frequency variations of the magnitude and phase of a transfer function as an ordered pair on the complex plane. At a given frequency, the gain and the phase are found. The gain determines the distance from the origin of the complex plane, and the phase determines the angle from the positive real axis.
Let examine the drawing of the Nyquist plot for
![]()
Substituting s with the frequency in the complex plane, gives
![]()
The amplitude of the above function is

and the phase from
![]()
is

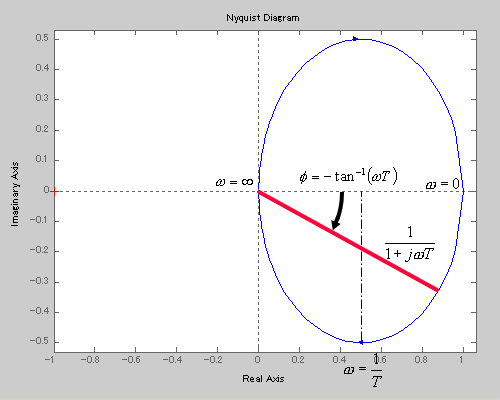
The Nyquist plot looks like

The Nyquist plot for 1-st order system (T=2)
Nyquist plot and system stability
The Nyquist plot provides a powerful tool for determining the stability of systems.
It is the plot of imaginary versus the real part (or a polar plot of magnitude and phase) of the open loop transfer function. However, the derivation of this technique is quite involved. Only a brief review is presented here.
Consider a transfer function D(s). Without proof, we state the following:
![]()
where no is the number of clockwise encirclements of the origin, PD is the number of the poles of D(s) in the right half plane (RHP), and ZD is the number of zeroes of D(s) in the RHP. For a counterclockwise traversal of the origin, no is negative. (Some authors reverse this definition.) Note that poles and zeroes of D(s) that are in the LHP, or on the imaginary axis, do not affect the above equation.
Now, reconsider the closed loop transfer function (with K=1):

Define the denominator of T(s) as

The poles of T(s) are equal to the zeroes of D(s). Note that the poles of G(s)H(s) are the same as the poles of D(s). This allows to rewrite the above stated result as
![]()
i.e. rather than examine D(s), we can examine G(s)H(s)=D(s)-1. The point of interest is shifted from the origin to the (-1, 0) point. We draw the Nyquist plot of G(s)H(s) and count the number of clockwise encirclements of the (-1, 0) point. The number of poles of T(s) in the RHP is equal to the number of encirclements plus the number of RHP poles of G(s)H(s). Do not forget that no is positive for clockwise traversal and negative for countercloskwise traversal.

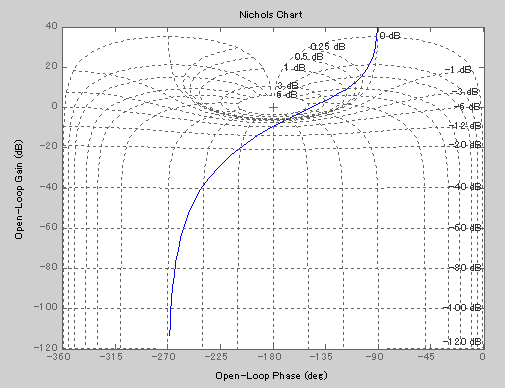
The chart consisting of constant-magnitude loci and constant phase-angle loci in the log-magnitude versus phase diagram is called Nichols chart.
Note that the critical point (-1+j0) is mapped to the Nichols chart as the point (0 dB, 180degree). The Nichols chart contains curves of constant closed-loop magnitude and phase angle. The designer can graphically determine the phase margin, gain margin, resonant peak magnitude, resonant peak frequency, and bandwidth of the closed loops system from the plot of the open-loop locus. The Nichols chart is symmetric about -180 degree axis The constant-magnitude loci and constant phase-angle loci repeat for every 360 degree, and there is a symmetry at every 180 degree. The constant-magnitude loci are centered about the critical point (0 dB, -180 degree).
The intersection of the open-loop frequency response curve and the constant-magnitude loci and constant phase-angle loci give the values of the magnitude and the phase angle of the closed loop frequency response at each frequency point. If the open-loop frequency response curve does not intersect the constant-magnitude loci but is tangent to it, then the resonant peak value of the closed-loop frequency response is given by that loci. The resonant peak frequency is given bay the frequency at the point of tangency.
Notice that the phase crossover point is the point where the open-loop locus intersects the -180 degree axis, and the gain crossover point is the point where the locus intersects the 0 dB axis. The phase margin is the distance (measured in degrees) between the gain crossover point and the critical point (0 dB, -180 degrees). The gain margin is the distance (in decibels) between the phase crossover point and the critical point. The frequency at the intersection of the open-loop locus and the -3 dB locus gives the bandwidth.